
Wi-Fi heatmap: what it is and how to make one at home
Network installers have used heatmaps for years to plan Wi-Fi in offices. At home the idea is the same and much simpler: measure in enough spots, put the results on a floor plan, and the weak areas become obvious.
In short
- A heatmap is a floor plan with readings taken around the home; the colours between readings are an estimate, not a measurement.
- You can make one by hand: a sketch of the floor plan, AirPort Utility on an iPhone, and a reading written in each spot.
- Take readings everywhere you use the Wi-Fi and on both sides of heavy walls, with the same phone, held the same way.
- Read the shape: a gradual fade means distance, a sharp edge means a wall, a whole weak floor means the slab.
On this page
A Wi-Fi heatmap is a floor plan coloured according to how good the Wi-Fi is in each spot: cool colours where it's strong, warm colours where it fades, red where it's gone. Professionals use them to decide where access points go in offices and hotels. At home they answer simpler questions, like whether the bedroom is weak because of distance or because of one wall, and where a mesh node would actually help.
What a heatmap really is
A heatmap is built from two things.
The first is a set of readings: in each spot you stand, a phone or laptop measures something about the Wi-Fi. That can be the signal level in dBm, or the behaviour of the connection, like how quickly and steadily the router answers.
The second is an estimate for everything in between. Software fills the space between your readings by weighting the nearby ones more than the distant ones. Those colours are educated guesses. Where you took many readings, they're reliable; where you left a big gap, they're a guess from far away.
One consequence matters more than any other: the estimate doesn't know where your walls are. Between a reading in the living room and one in the bedroom it draws a smooth gradient, even if a concrete wall in between makes the real change a cliff. That's why good heatmaps have readings on both sides of every heavy wall.
How to make one by hand
You don't need special software to get most of the value.
- Sketch the floor plan on paper, roughly to scale. Mark the router.
- Turn on the Wi-Fi scanner in Apple's free AirPort Utility on an iPhone (how to check Wi-Fi signal strength on iPhone), or use Option-click on the Wi-Fi icon on a Mac, or a Wi-Fi analyser app on Android.
- Walk the home and write the reading in each spot on the sketch: the middle of every room, where you sit or work, the doorways, and both sides of any wall you suspect.
- Colour it: for example green at -60 dBm or better, yellow between -60 and -70, orange between -70 and -80, red below -80.
Twenty readings on a sketch already tell you where the problems are and what kind they are.
Making one with an app
Apps save you the sketching and the colouring, and fill in the space between readings.
On laptops, Wi-Fi survey programs read the signal level as you click your position on an imported floor plan. On an iPhone, apps can't read the signal level: iOS doesn't give it to them. Our app, WiFi Heatmap, works around that by drawing the floor plan with the camera and measuring how the connection behaves in each spot instead, and how we test explains exactly what it measures and what it can't.
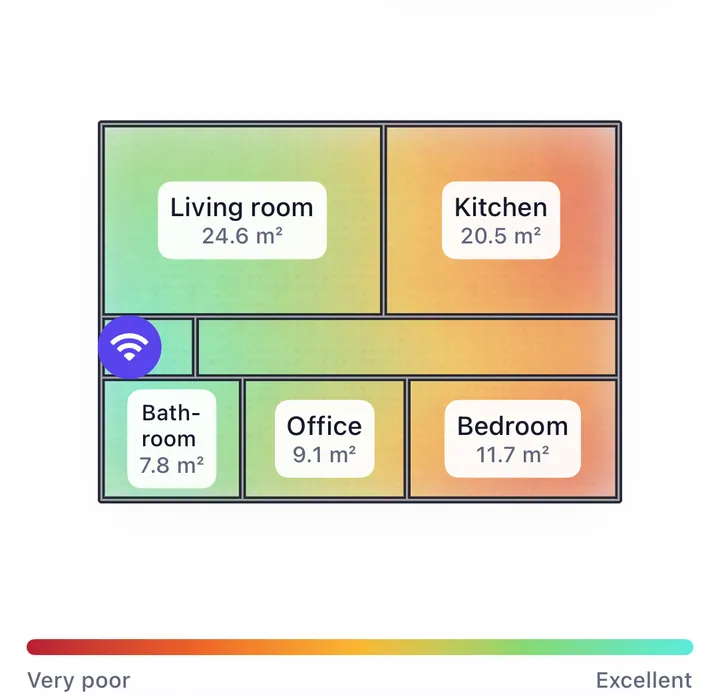
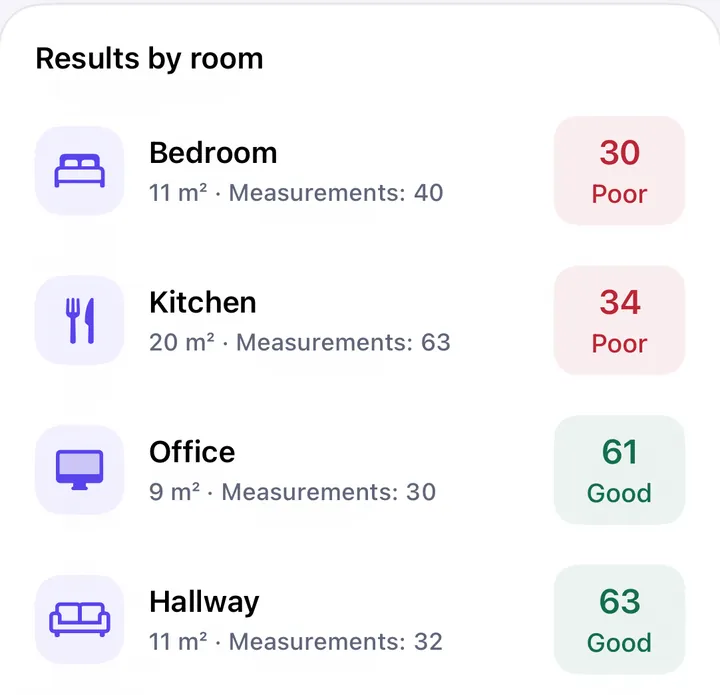
Whatever tool you use, the map shows you where; a list of rooms with their scores tells you how much, and which room to fix first.
How to take readings that mean something
- Cover every place you use, not just the centre of rooms: the desk, the bed, the sofa, the garden table.
- Add readings at doorways and on both sides of thick walls, so the map doesn't invent a smooth gradient where there's an edge.
- Use the same phone for the whole survey, held the same way, at the height you normally use it. Different phones have different antennas.
- Pause a few seconds in each spot. Readings move by a few dB from moment to moment.
- Map at the time the problem happens, if it depends on the time of day.
- Measure each band separately if your devices use both. 2.4 and 5 GHz draw very different maps of the same home.
How to read the result
Look at the shape of the colours rather than at any single number.
- A gradual fade across several rooms means distance: the router is too far from those rooms, usually because it's in a corner. Moving it toward the middle helps. See where to put the router.
- A sharp edge at one wall means that wall is the barrier. You need a way around it. See what blocks Wi-Fi at home.
- A whole weak floor means the slab. That floor needs its own access point. See Wi-Fi weak upstairs.
- Good colours but a slow connection means the cause isn't coverage: interference, a busy line or the device. See full bars but slow Wi-Fi.
Use it before and after
The second map is more useful than the first. Make one, change a single thing, such as the router's position or a new node, and make another along the same route. The difference tells you whether the change worked, which a feeling can't.